A Quick Look at the US Data Science Job Market, February 2017
tl;dr As far as data science job postings go, certain “big data” technologies have their highest demand in San Francisco. Denver, not traditionally known as a data science hub, appears to have a lot of jobs in this area – but looks can be deceiving. Where should you look for a job if you don’t have a degree? San Francisco. Where should you look for a job if you have a Ph.D? San Francisco, Boston, New York.
This is the era of Big Data, we are told. Contemporary technology is such that a constant stream of data regarding the operational aspects of any business – from the performance characteristics of jet engines as they are in transit over the Pacific, to the browsing habits of consumers in a brick and mortar store – can be captured in realtime. However, to translate this data into business value requires a unique set of skills. Enter the “data scientist”, proclaimed to have the “sexiest job of the 21st century”.
Broadly speaking, a data scientist is a skilled professional with the business acumen to identify the right questions to ask. A data scientist is an analytical thinker with the statistical chops to investigate these questions, finding the true signal in a world of noise. And of course, a data scientist moonlights as a software engineer of sorts, able to use the appropriate tools to actually carry out such analyses (and perhaps even develop infrastructure for this purpose).
It would be naive to think that one person necessarily does all of the above, and it is perhaps better to consider more specific roles which, broadly speaking, data scientists fill. Still, at present it seems that the name “data scientist” is often used to refer to someone who fulfills any one or more of these specific roles.
The roots of data science run deep. In a more traditional business setting, a person performing such tasks – identifying business questions, performing quantitative investigations using a computer, and framing answers – may have been called a “business analyst”, or some variant thereof. However, there are some important distinctions to be made here.
The sheer size and variety of relevant datasets has grown. Gone is the day of cramming everything into a single spreadsheet. Furthermore, there are myriad formats for the data itself, and it is a serious task to even prepare such datasets for analysis.
The statistical methods have evolved. Although quite a bit can still be done with simple “A/B” testing and linear regression, there is also role for modern Bayesian techniques, as well as more complicated predictive models.
The questions (and the data used to answer them) are more fine-grained than what would have been traditionally investigated. Part of this is due to “software eating the world”. The sort of data that Uber or Amazon are gathering, and the available “interventions” – operational changes based on a quantitative analysis of this data – is inherently different from what would have been possible for a taxi company or retail storefront in the 1980s, for example.
So data scientists are playing a different game than the business analysts of yesteryear. This requires a different set of skills, a mastery of different technologies, and tends to draw people from a different background than more traditional data analyst roles1.
Goal
From the viewpoint of an individual on the data science job market, some natural questions arise: What are the skills and backgrounds which employers are looking for in viable job candidates? And how do these desired skills vary from place to place?
By skills, what I have in mind are fairly concrete, technical capacities: the ability to write SQL queries, or to code in Python, for example. I also have in mind a very narrow notion of “background”: what sort of degrees are employers using to screen candidates, or what sort of past work experience is valued.
Considering place-by-place differences, one might imagine a data scientist in San Francisco, working at Airbnb, to use different tools and techniques as compared to say, someone at a bank in Dallas. Since Dallas is filled with banks, and San Francisco is filled with tech companies, such differences would manifest themselves systematically in job postings for job postings for data scientists across these two regions. What is the nature of such differences?
A job market is a nebulous thing. As a proxy for actual job markets, we consider job listings on http://indeed.com. Thus we shall be considering the indeed.com search results for “data science”, with respect to a specified region. The task of this analysis will be to gather all of these results, and from them compute the frequency of certain words or phrases, so as to answer such questions as: Among all data cience job postings in Seattle, what percentage mention R? And how does this quantity differ from what is observed in, say, San Fransico?
The analysis presented here is motivated and inspired by an earlier blog post, found here. As that analysis is several years old now, and for the sake of personal edification, I have undertaken a similar study.
Methods
There are three basic tasks here. First, indeed.com job postings must be “scraped” and stored in a convenient format. Second, the text of these postings must be structured in a way amenable to computing word frequencies. The third task, which I don’t discuss in this post, is presenting these results, e.g. by way of graphics.
This is all done with a few python scripts. Full code for the analysis can be found here. Let me mention a few high points.
Collecting Posts
The code to actually gather the text of job postings from indeed.com is found in jobscrape.py. As an example of the usage, to save the text of all “data science” postings in the Seattle area to the file seattle_results.txt, simply invoke
python3 jobscrape.py "data science" "Seattle, WA" seattle_results.txtSearch results on indeed.com contain several pages of links, each link redirects to a posting. The basic task is to extract the text of these postings, and save the results in a file. At a high level then, what is happening is this:
def main(query,location,outfile):
    print("Getting job links...")
    links = job_search(query,location)
    print("Getting postings...")
    postings = get_job_postings(links)
    print("{} postings found. Saving...".format(len(postings)))
    save_postings(postings,outfile)
A main tool used here is BeautifulSoup, which is a convenient library for converting html to a Python object which can be navigated hierarchically. The documentation for BeautifulSoup is quite good, as is this tutorial on web scraping with BeautifulSoup.
Given a url, the first stage of processing is to initiate a http request, open the url, and construct a BeautifulSoup object. Here I use python’s urllib package.
def get_response(url):
    """ Opens the url. """
    # this won't work unless we spoof the User-Agent
    req = Request(url, headers={'User-Agent': 'Mozilla/5.0'})
    return urlopen(req)


def make_soup(url):
    """ Make BeautifulSoup from the url. """
    html = get_response(url).read()
    return BeautifulSoup(html, "lxml")
With a BeautifulSoup object constructed from a single search results page, the task of extracting job links is fairly simple. This is hardcoded, and based simply on a manual inspection of the html structure of indeed.com search results.
def get_job_links(soup):
    divs = soup.find_all('div', 'result')
    anchors = [div.find('a', 'turnstileLink') for div in divs]
    links = [BASE_URL + a['href'] for a in anchors]
    return links
There are typically too many listings to fit on a single page, and so one must visit quite a few pages and extract the listings from each. This can be done concurrently across several pages (opening the http connection and downloading the page takes a while, so even on a single-core machine you want multithreading). I use the concurrent.futures module to manage concurrency, and the nifty tqdm to display a progress meter.
def job_search(query,location):
    """ Return all Indeed.com job links associated
        with the given query and location."""
    links = []
    page_urls = search_page_urls(query,location)

    with futures.ThreadPoolExecutor(NUM_THREADS) as ex:
        to_do = [ex.submit(lambda url: get_job_links(make_soup(url)),url)
                 for url in page_urls]
        done = futures.as_completed(to_do)
        done = tqdm.tqdm(done, total=len(page_urls))
        for future in done:
            links += future.result()
    return links
With the job links, a call to get_job_postings starts similarly: given a list of job posting url’s, we concurrently open these and construct BeautifulSoup objects. Here though the objective is to recover the actual text content of the posting. It’s important to not include text that is not visible to a reader, so a bit of filtering must be done. My solution is basically just what is given at this Quora post.
def visible(element):
    if element.parent.name in ['style', 'script', '[document]', 'head', 'title']:
        return False
    elif re.match('<!--.*-->', str(element.encode('utf-8'))):
        return False
    return True


def get_text(url):
    """ Returns visible text, extracted from the location at url. """
    soup = make_soup(url)
    data = soup.find_all(text=True)
    results = filter(visible, data)
    return ' '.join([str(s) for s in results])
The text alone isn’t quite enough for our purposes – we also want to keep track of the job urls (in order to properly handle duplicate postings). Hence the following wrapper.
Posting = namedtuple('Posting', ['url', 'text'])

def get_posting(url):
    """ Get the end job url and visible page text. """
    try:
        redirected = get_response(url).geturl()
        text = get_text(redirected)
        return Posting(redirected,text)
    except:
        return None
There’s a bit more that I haven’t mentioned, but one can get a sense of the general approach here. The above is essentially a batch job – running a query on my computer can take anywhere from 30 seconds to an hour, depending on my connection and the number of job postings. Postings – their urls and extracted text – are simply dumped to a file at the end of this.
def save_postings(postings, filename):
    with open(filename, "w") as f:
        json.dump(postings, f)
Computing Word Frequencies
In analyzing the text of postings, I use nltk to tokenize the text, and gensim to convert a list of tokens to sparse matrix format convenient for running the sort of queries which we intend to. A simple wrapper, for our specific purposes, can be found in corpus.py. Here’s a listing of that file.
import nltk
from nltk.corpus import stopwords
from gensim import corpora
import gensim
import numpy as np


def get_cleaned_tokens(text):
    """ Returns a list of tokens from text, cleaned
        and with stopwords removed. """
    words = nltk.word_tokenize(text.lower())
    stops = set(stopwords.words("english"))
    tokens = [w.encode('ascii',errors='ignore').decode()
              for w in words if w[0].isalpha() and w not in stops]
    return tokens


class Corpus:
    def __init__(self, raw_texts,filter_extremes=True):
        texts = [get_cleaned_tokens(text)
                 for text in raw_texts]
        self.dictionary = corpora.Dictionary(texts)
        if filter_extremes:
            self.dictionary.filter_extremes()
        self.corpus = [self.dictionary.doc2bow(text) for text in texts]
        self.rev_dictionary = {v:k for k,v in self.dictionary.iteritems()}
        self.matrix = gensim.matutils.corpus2csc(self.corpus)

    def num(self,contains=None):
        if contains is None:
            return len(self.corpus)
        if type(contains) == str:
            try:
                k = self.rev_dictionary[contains]
                return self.matrix[k,:].getnnz()
            except:
                return 0
        else:
            keys = [self.rev_dictionary[word]
                    for word in contains if word in self.rev_dictionary]
            if len(keys) == 0:
                return 0
            entries = np.sum(self.matrix[keys,:],axis=0)
            return np.sum(entries > 0)
The key operation on a Corpus object, once it has been constructed, is the num method. The result of c.num("foo") is to return the number of distinct documents in corpus c containing “foo”. For slightly more general queries, c.num(["foo", "bar"]) gives the number of documents containing either “foo” or “bar”, without any double-counting.
Analysis
We looked at job postings for five major cities. Displayed below is a table showing the number of indeed.com search results, as well as the number (necessarily smaller) of distinct postings for these results.
| City | Indeed Search Results | Distinct Postings |
|---|---|---|
| Boston | 8235 | 537 |
| Denver | 3615 | 492 |
| New York | 12390 | 430 |
| San Francisco | 9465 | 480 |
| Seattle | 10995 | 462 |
To clarify what I mean by distinct, note that indeed lists jobs along with a short description, as well as a URL for a more complete posting (often hosted by the company responsible for the posting). I say two indeed.com search results are distinct if these URLs are distinct.
There are a few reasons for the order-of-magnitude difference between the number of distinct postings and the number of search results. Some of the search results might simply be resposts of still-unfilled positions, others may correspond to postings that have already been filled (and thus removed), and some may simply contain broken or dead URLs. I don’t at the moment try to categorize results as such, but it would be interesting to follow up on this.
Language Comparisons
One striking feature of the above table is the large number of results for Denver (a major metropolitan area, but not conventionally considered to be a “data science” hub on the scale of, say, New York City or San Francisco). I think the following comparison of the frequency of postings mentioning R and Python across these cities is illuminating.
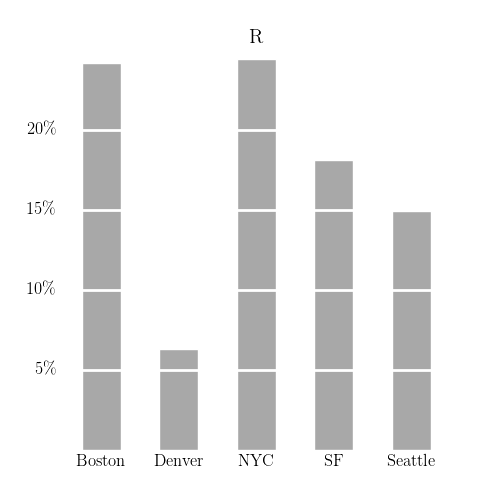
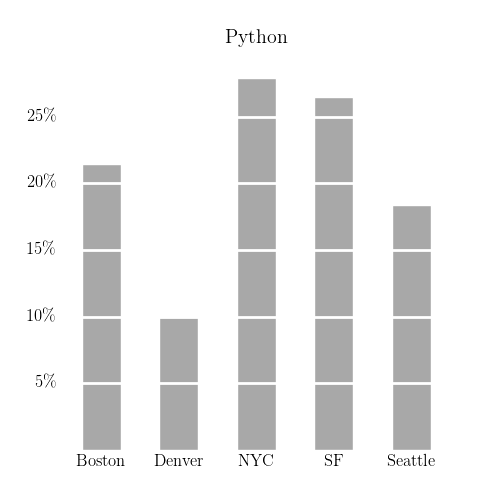
Seattle’s a Python city, whereas (by a smaller margin) Boston is an R city. There are countless varieties of just-so stories that one can concoct to explain this2. By comparison, Denver seems to be neither a Python nor a R city. So what is it that the Denver postings are looking for?
Here’s one suggestive figure:
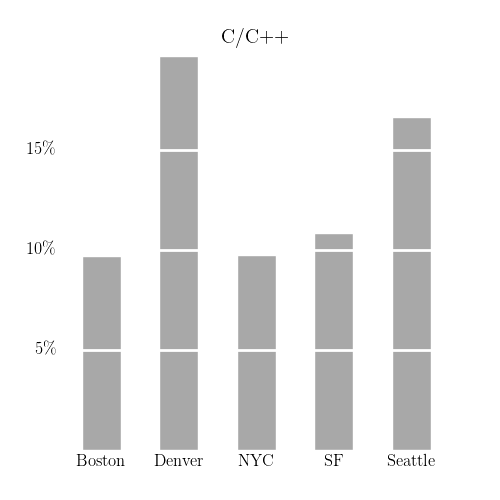
There are at least two ways to explain the high frequency of ‘C’ or ‘C++’ appearing in Denver’s postings. First, it’s possible that there are a large number of Denver employers interested in using their data in new ways, but a necessary ingredient in this is the development of appropriate ‘data pipelines’. If existing infrastructure in these organizations is based around C/C++, then it would be natural to hire C/C++ engineers for such positions.
A second possibility (not exclusive from the first) is that these jobs are doing the same things they would have been doing 5 years ago, but now the postings have been written such that they appear in “data science” job searches. San Francisco, for example, attracts flocks of talented individuals to ‘data science’ positions. The state of the field, as it stands, is rather young – I know of universities trying to establish “Institutes for Data Science” without even quite knowing what it is that they want to do. Amidst this confusion, it might be appealing to certain employers to attract candidates by rebranding traditional positions as ‘data science’ positions.
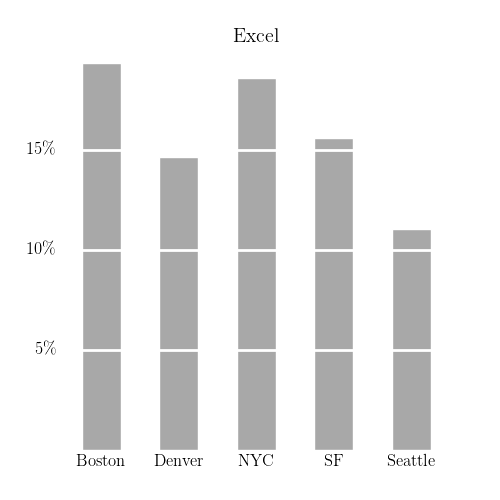
Likewise, many “data science” jobs may simply be rebranded versions of more traditional “spreadsheet jockey” positions. A quick (and naive) proxy for measuring this to look at the frequency with which the word ‘excel’ is mentioned3.
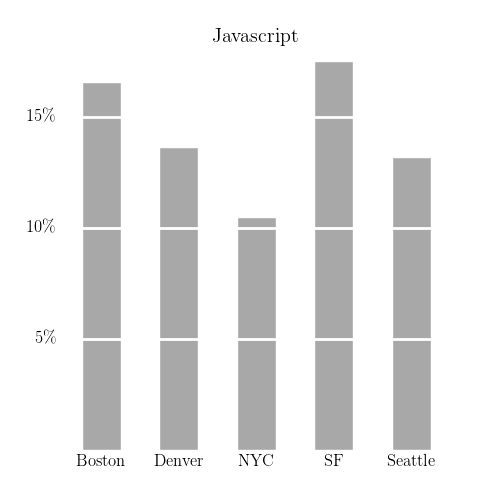
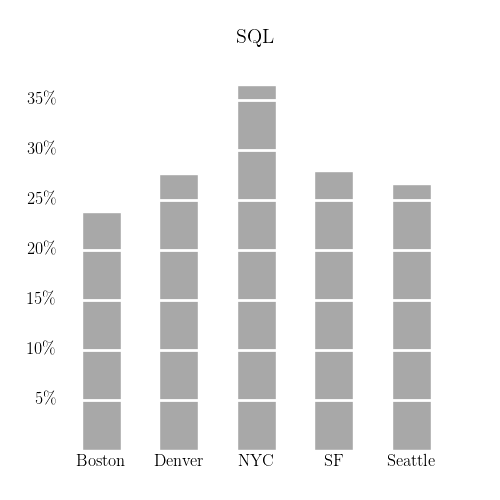
I made similar charts for a few other search terms: 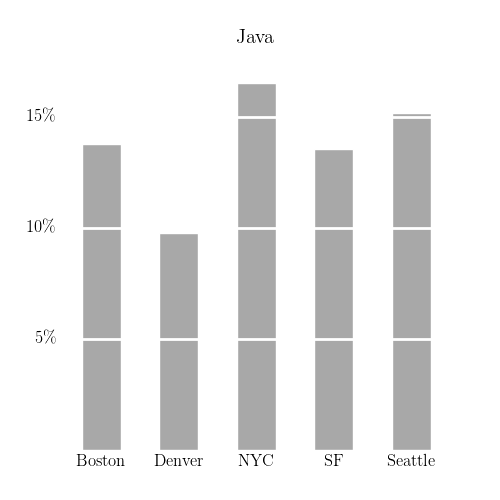
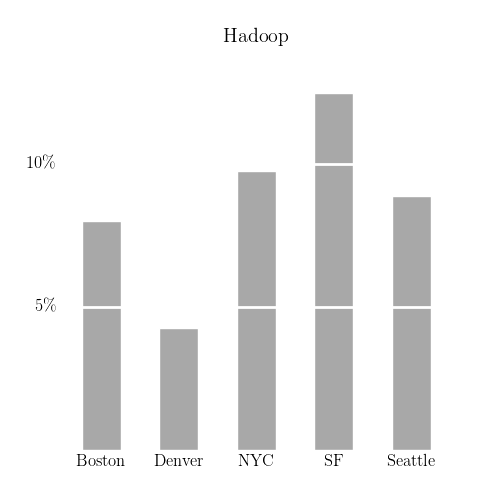
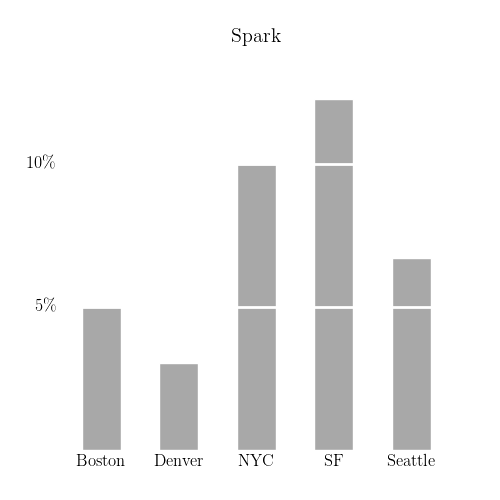
“Big Data” Technologies
Programming languages aside, when dealing with very large datasets, there’s a need to organize computations in a scalable manner. Two popular frameworks for this, both based on the MapReduce model, are Hadoop and Spark. Both of these frameworks are at their most popular in San Francisco, as seen below.
Educational Background
Finally, let’s consider the sort of educational backgrounds mentioned in these postings.
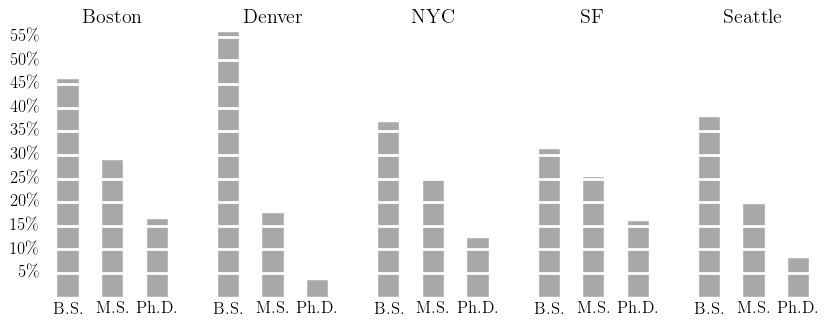
Two interesting features appear. First of all, Boston and San Francisco have the highest proportion of jobs explicitly mentioning a Ph.D, with New York not far behind4. On the other hand, San Francisco has the lowest rate of jobs mentioning explicitly a Bachelor’s degree5. This is in stark contrast with Denver.
Conclusions
We’ve looked at the frequency at which certain terms appear in data science job postings across various cities. This sort of approach paints a picture – a very rough and incomplete picture – of how the job markets across these cities vary. Although we’ve considered only a few basic questions, such as the preference for ‘R’ versus ‘Python’, or the sort of degrees mentioned, there is still a lot more analysis that could be done with this approach. Some of this analysis may be simply confirming various preconceptions, but even this is valuable.
Footnotes
On this note, I would posit that, all other things being equal, the title “data scientist” sounds a lot sexier than “business analyst”. Related to this is another phenomena: an overproduction of science PhD’s, who are looking for a way to parlay their backgrounds into nonacademic careers. From this perspective, the title “data scientist” is a natural win over “business analyst”. It allows for individuals trained as scientists to call themselves scientists, while at the same time attracting this talent to roles which they may otherwise have not considered.↩
For example, perhaps Boston skews more “academic” than Seattle does, and the sort of people who are looking for work in Boston come from disciplines which emphasize R more. Seattle is bristling with software developers looking to market themselves as data scientists, and Python would be more appealing to these individuals. This is speculation, of course.↩
To be clear here, what I am implying is that explicitly mentioning Excel in a job posting signals a certain sort of work and workflow.↩
The explicit words I searched for here were ‘phd’, ‘ph.d’, ‘ph.d.’, and ‘doctorate’. As to why San Francisco and Boston top the charts in this category, I can offer some theories. First, these are both attractive locations for academics, and they both have a reputation of being places where “smart people” live (MIT/Harvard for Boston, Berkeley/Stanford + the tech scene in the Bay Area).
Second, a Ph.D. is almost certainly not needed to fulfill the actual responsibilities of most jobs that mention it. It serves as a proxy for various desireable traits, and mentioning it serves a useful signalling role. Supposing that you are hiring in a place where 15% of the jobs mention explicitly a Ph.D., it may be to your benefit to also mention a Ph.D (or risk the job posting appearing to be ‘second grade’ or ‘inferior’ in some way, at least amongst academically-minded candidates).↩
The words here are ‘bs’, ‘b.s.’, ‘bachelor’, ‘bachelors’. Note that I don’t catch phrases like “four year degree”.↩